Table of Contents
Ion Identification
Chemical Monitoring and Management
- Chemical monitoring and management are needed to ensure the health and wellbeing of plants, animals, and humans.
- Monitoring also allows for preservation and maintenance of natural landscapes.
- For example, monitoring the Ozone layer allowed for the identification of the destructiveness of CFCs (as seen in module 7), enabling manufacturers to reduce their usage of these hazardous chemicals
- Compounds of mercury, arsenic, and other hazardous elements have been identified and monitored through chemical techniques.
- Nutrient-rich soil and land fertility can be determined via chemical analysis.
Qualitative Ion Analysis - Key Terms
- Precipitate - insoluble salt formed when 2 ionic solutions are mixed.
- Qualitative Analysis - Identification of the constituent components of a sample (e.g. there is selenium, arsenic, and phosphorus in this sample of ore)
- Quantitative Analysis - Measurement/Determination of the quantities of the constituents of a sample (e.g. there is 30g of Mercury per 1kg of soil)
- Destructive Testing - Any testing which irreversibly alters the composition of a sample (e.g. melting it in acid)
Qualitative Ion Analysis - Precipitation Reactions
- You DEFINITELY need to know your solubility rules for this module.
- In the following table, higher rules take precedence. For example, $\ce{Li2CO3}$ is soluble, because the rule about group 1 being soluble takes priority over the rule about carbonates being insoluble.
| Rule | Special Exceptions |
|---|---|
| Group 1 and ammonium compounds are soluble | None |
| Nitrate Salts and Acetate Salts are soluble | None |
| Iodide, Chloride and Bromide salts are soluble | $\ce{Ag+,Pb+,Hg+}$ |
| Sulfate salts are soluble | $\ce{Ag+,Pb^{2+},Hg+,Ba^{2+},Ca^{2+},Sr^{2+}}$ |
| Hydroxide salts are insoluble | $Ba^{2+},Ca^{2+}$ are slightly soluble |
| Carbonates and Phosphates are insoluble | None |
Precipitation Colours
- One of the easiest ways to identify the components of a compound is through a precipitation reaction. As different compounds produce different colored precipitates, you can use the table below to find which ions are present in the precipitate.
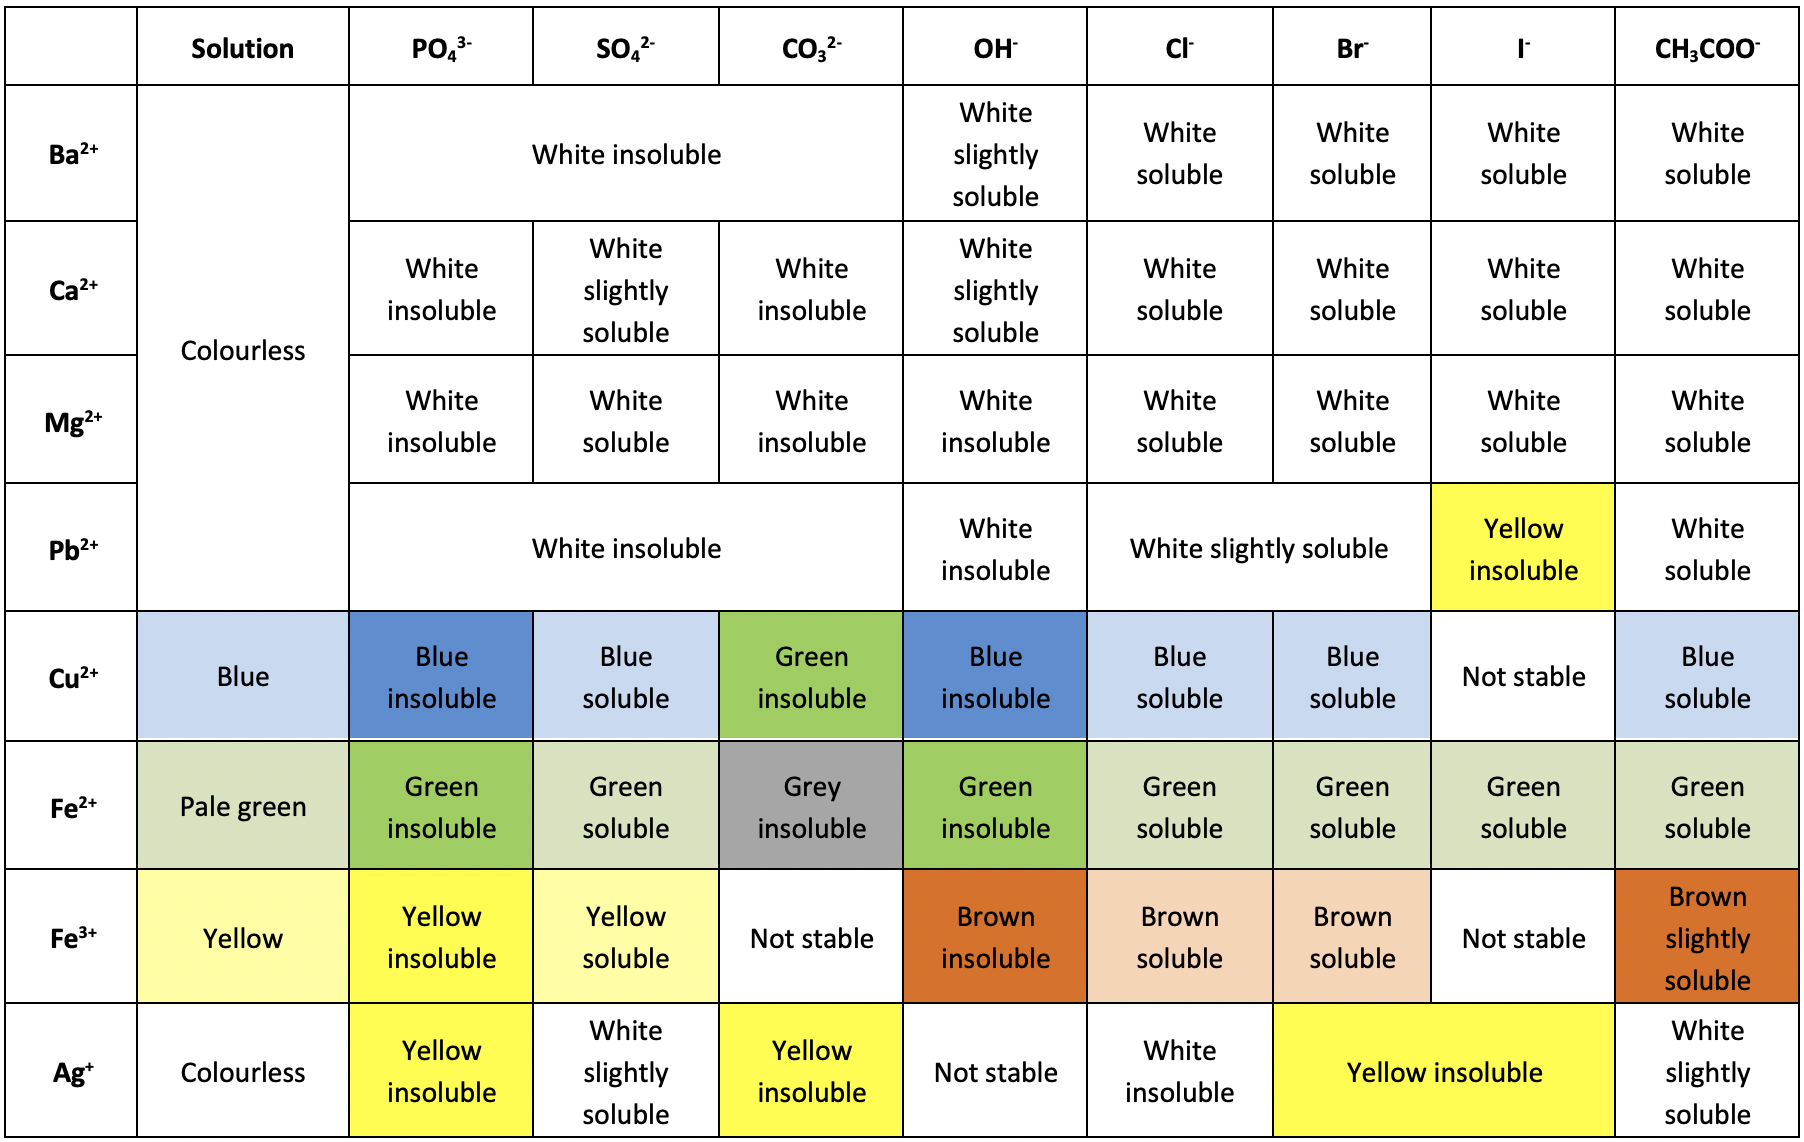
- For example, say you have an unknown substance, which can be dissolved in water.
- After adding Sulfuric acid to the compound, you notice that a blue precipitate is formed.
- From this, you can assume that the cation of your unknown was probably Copper (II) $\left(\ce{Cu^{2+}}\right)\newcommand{orange}{\color{orange}}$.
- Precipitation reactions are a form of destructive testing. Essentially, whatever quantity of the sample you used to perform the precipitation reaction is no longer usable as the original compound.
- Had the unknown been, say, Copper (II) Phosphate, then whatever amount you used in the precipitation reaction is no longer Copper (II) Phosphate, and so has been effectively “destroyed” (not really destroyed, because of Conservation of Mass).
Complexation Reactions
Complexation reactions can be used to identify transition metal ions, such as $\ce{Ag+,Cu^{2+},Fe^{2+}, and Pb^{2+}}.$
A complexation occurs when a “coordination compound” forms:
- Coordination compounds are made up of a central cation, coordinated to anions or polar molecules.
- The coordinating substances (the anions and polar molecules) are known as Ligands, and are either neutral or negatively charged.
- Examples include $\ce{H2O,NH3,Cl-, and CN-}$ (water, ammonia, chloride, and cyanide)
Coordination complexes typically have distinct colours, which is how we can use them for qualitative analysis.
They have special notation as well (because IUPAC loves special notations):
- Coordination complexes are indicated by square brackets: $\ce{[Cu(OH2)6]^{2+}}$ is called a “hexaaquacopper (II)” ion:
- “Hexa-” = 6
- “Aqua-” = water
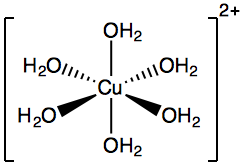
Hexaaquacopper (II) ion diagram. - Coordination complexes are indicated by square brackets: $\ce{[Cu(OH2)6]^{2+}}$ is called a “hexaaquacopper (II)” ion:
You don’t actually need to know the names, but you do need to know the notation.
Water Complexation
- When transition metal ions dissolve in water, a complexation reaction occurs.
- For example, Iron (II) Chloride:
$\ce{FeCl2_{(aq)} +6H2O_{(l)}→ [Fe(OH2)6]^{2+}_{(aq)} +2Cl-_{(aq)}}$
- Water molecules (ligands) coordinate with the transition metal
- Charge stays the same as the original cation (Iron and Chloride dissociate in water, because polar-polar solution)
Complexation Identification
- Complexation reactions can be used in conjunction with precipitation to identify ions
- For example, Silver Halides can be distinguished due to their complexation in Ammonia:
- $\ce{AgCl}$ is soluble in dilute ammonia $(\ce{AgCl +2NH3<=> [Ag(NH3)2]+ +Cl-})$
- $\ce{AgBr}$ is soluble in concentrated ammonia $(\ce{AgBr +2NH3 <=> [Ag(NH3)2]+ +Br-})$
- $\ce{AgI}$ is insoluble in ammonia
- This can be used to distinguish between Silver (II) and Lead (II), because Lead (II) Chloride doesn’t dissolve in ammonia.
- Complexation tests can also be used to confirm predictions:
- Iron (III) ions react with thiocyanates $(\ce{SCN-})$ to produce blood red $\ce{[Fe(SCN)]^{2+}}$
- Copper (II) ions react with ammonia to form a pale blue $\ce{Cu(OH)2}$, which then dissolves to form a darker blue $\ce{[Cu(NH3)4]^{2+}}$
Flame Tests!!!
- A flame test is used to qualitatively identify some metal ions in a sample.
- It can be used to distinguish between cations that undergo similar precipitation reactions.
- For example, $\ce{Ba^{2+}}$ and $\ce{Ca^{2+}}$ or Group 1 metals.
- However, not all metals produce a diagnostic flame colour.
Atomic Emission
- The colour of a flame test is a product of the atomic emissions of a metal.
- The heat energy from the flame excites electrons within the metal, making them jump to higher energy levels.
- When the electron attempts to drop back down, it releases the energy in the form of light.
- Due to physics things (the “quantum” part of quantum mechanics is what explains this), every element has a specific set of wavelengths it will emit in this manner (influenced by the different binding energies between the electron and nucleus, distance from the nucleus, repulsion by other electrons, etc.)
- The colours most intensely emitted by this process are what are observed in a flame test.
- Some elements have emissions in the UV or IR parts of the electromagnetic spectrum, so their colour isn’t as pronounced as other elements.

Flame test colours (now with $\LaTeX$ colourisation)
| Metal Ion | Colour |
|---|---|
| $\ce{Ba^{2+}}$ | $\color{#a3ff00}{\text{Apple Green}}$ |
| $\ce{Ca^{2+}}$ | $\color{#DD6E0F}{\text{Brick Red/Orange}}$ |
| $\ce{Mg^{2+}}$ | No characteristic colour |
| $\ce{Pb^{2+}}$ | $\color{#6699cc}{\text{Grey-Blue}}$ |
| $\ce{Cu^{2+}}$ | $\color{green}{\text{Green}}$ |
| $\ce{Fe^{2+}/Fe^{3+}}$ | $\color{#996600}{\text{Orange-Brown}}$ |
| $\ce{Ag+}$ | No characteristic colour |
Limitations of the Flame Test
- Can only be used for some metal cations
- Destructive test
- Can be ambiguous due to similar colours
- Different oxidisation states cannot be determined, such as Iron (II) and Iron (III)
- Interference can be caused by other metal ions
Additional Tests for Ion Identification
- Conjugates of strong acids and bases will dissolve to produce a solution with neutral pH. Conjugates of weak acids/bases will produce a non-neutral pH.
| Basic Ion | Neutral Ion |
|---|---|
| Hydroxide | Chloride |
| Acetate | Bromide |
| Carbonate | Iodide |
| Phosphate | Sulfate |
- Carbonate anions can be identified via acid-carbonate reactions (product of $\ce{CO2}$ bubbles can be tested through limewater)

Identifying Anions

Gravimetric Analysis
Gravimetric analysis uses the mass of product (precipitate) formed through a precipitate reaction to quantify a target ion.
It is used in applications such as monitoring water quality, determining the mineral composition of soil and product testing.
There are 3 main steps:
- A known quantity of a sample is dissolved in water.
- The target ion is precipitated using a reagent (excess reagent should be added).
- The precipitate is collected by filtration, then washed, dried, and weighed.
The reagent used must react selectively with the target ion AND form a highly insoluble precipitate in order to provide accurate results.
The reagent can be chosen using the solubility rules, while the precipitate’s solubility can be found by calculating the solubility product constant $(K_{sp})$
The quantity of the target ion is (usually) expressed as a % mass of the original sample
Assumptions of Gravimetric Analysis
Gravimetric analysis assumes that:
- Only the target ion precipitates out.
- 100% of the target ion present in the sample precipitates out.
- All of the precipitate is collected.
- All of the collected substance is a pure sample of the precipitate.
Sulfate Content of Fertiliser (Practical)
- Fertilisers contain ammonium sulfate $(\ce{(NH4)2SO4})$ as a sulfur source for plants.
- The amount of sulfate can be determined through gravimetric analysis, by adding a Barium reagent to form the highly insoluble $\ce{BaSO4}$.
- Barium can precipitate carbonate, chloride, phosphate, and hydroxide anions too.
- To precipitate carbonates, add acid in excess
- To precipitate phosphate and hydroxide, acidify the solution (don’t use sulfuric acid though)
- To precipitate chloride, add silver nitrate in excess.
- If other anions precipitate with Barium, the mass of the residue will increase. Therefore, a higher concentration will be calculated.
Pros and Cons of Gravimetric Analysis
| Advantages | Disadvantages |
|---|---|
| Very accurate (assuming experimental design is correct) | Target ion must be able to form a highly insoluble precipitate |
| Doesn’t require specialty equipment, just normal lab gear | Precipitate must be highly pure |
| Does not require a calibration curve, which can take up more time | Much more time consuming than modern techniques |
| Concentration of the target ion must be high enough to produce a precipitate that can be accurately measured |
Precipitation Titrations
- Precipitation titrations are commonly used to find the concentration and quantity of halides (fluoride, chloride, bromide, iodide)
- Usually, silver compounds are the titrant, so this style of titration gets a special name: argentometric titration.
- There are 3 main methods of titration: Mohr’s, Volhard’s, and Fajan’s.
Mohr’s Method (Direct Titration)
- Quantifies chloride, bromide, and cyanide ions using direct titration, with a standard silver solution.
$\orange{\ce{Ag_{(aq)}+ +X_{(aq)}- →AgX_{(s)}}}$
- Yellow Potassium Chromate $(\ce{K2CrO4})$ is used as the indicator.
- Silver preferentially precipitates with halides, and when excess silver is added it will react with chromate ions to produce a reddish-brown precipitate $(\ce{Ag2CrO4})$.
Limitations of Mohr’s Method
The presence of multiple anions in a sample can lead to invalid results, especially in the cases of carbonate and phosphate (which precipitate readily with silver)
The conical flask must be thoroughly stirred during the titration to ensure the silver ions are evenly distributed, so that silver chromate does not precipitate early
Titration must be conducted between pH 6.5 and 9.0:
- At pH < 6.5, the chromate ion (a weak base) accepts $\ce{H+}$ to become $\ce{HCrO4-,}$ so there will not be enough chromate in solution to produce the end point colour change. $\ce{HCrO4-}$ is also bright orange, which obscures the endpoint.
- At pH > 9.0, the concentration of $\ce{OH-}$ is too high. It will form a precipitate with $\ce{Ag}$ to produce $\ce{AgOH}$ which is a brown precipitate. It also obscures the endpoint and increases the silver needed to reach it.
Mohr’s method is suitable for the analysis of chloride and bromide ions, but not iodide or thiocyanate ions.
- This is because the chromate ions are strongly adsorbed to the surface of $\ce{AgI}$ and $\ce{AgSCN}$ precipitates, making the endpoint indistinct.
In this precipitation titration, the concentration of the indicator used is quite low as adding too much chromate indicator will lead to an intense yellow colour which masks the end point.
- As a result, the excess titrant required to cause a colour change is relatively large.
- $\ce{2Ag+ +CrO4^{2-} <=>Ag2CrO4}$
- Small concentrations of chromate mean that the equilibrium is towards the left. To shift it right, large amounts of silver needs to be added.
- This excess silver leads to a systematic error, although this can be corrected using a blank titration:
- The same quantity of chromate indictor is to be used in the titration is added to a suspension of calcium carbonate (which imitates the white $\ce{AgX}$ precipitate).
- $\ce{AgNO3}$ is added to the solution until a colour change occurs.
- The volume of $\ce{AgNO3}$ required to cause the colour change in the blank is the excess volume required.
- This volume is subtracted from the titration volumes.
Volhard’s Method (Back Titration)
Volhard’s method quantifies anions using back titration.
- A known, excess quantity of silver nitrate is added to the sample to precipitate all of the analyte ions.
- $\ce{Ag+ +X- →AgX}$
- The excess silver nitrate is determined by back titration against a Potassium Thiocyanate $(\ce{KSCN})$ standard solution.
- $\ce{Ag+ +SCN- →AgSCN}$
- A small amount of Iron (III) is added as an indicator. When excess thiocyanate is present, there will be a permanent color change.
- $\ce{Fe^{3+} +SCN- → [Fe(SCN)]^{2+}}$
Limitations of Volhard’s Method
- Volhard’s method must be performed in low pH to prevent the precipitation of Iron (III) as $\ce{Fe(OH)3}.$ At low H, there is relatively low amounts of hydroxide ions, so no Iron (II) Hydroxide will form.
- The Volhard method is less valid if the first precipitate is more soluble than silver thiocyanate.
- For example, $\ce{AgCl}, (K_{sp}=1.77\times10^{-10})$ is more soluble than $\ce{AgSCN}, (K_{sp}=1.03\times10^{-12}),$ so the silver chloride will dissolve during the titration, leading to a greater titre volume.
- This can be avoided by filtering the first precipitate out, but this can lead to inaccuracies.
Fajan’s Method (Direct Titration and Adsorption Indicator)
In the analysis of chlorise, an anionic dye is added to the sample.
- A standard solution of silver nitrate is added, and the precipitation occurs.
- $\ce{Ag+ +Cl- →AgCl}$
- Before the equivalence point, a small excess of chloride ions is incorporated into the precipitate, so it carries a negative charge. The dye is repelled and remains in solution.
- After the equivalence point, there is a small excess of silver ions. Therefore, the precipitate becomes slightly positively charged, and the dye adsorbs onto it, resulting in a precipitate colour change.
- The most suitable indicator depends on the analyte.
Limitations of Fajan’s Method
- Fajan’s method relies on a large precipitate surface area, to allow sufficient dye to adsorb so the colour change is easily visible.
- Dextrin (starch) can be added to prevent silver halide precipitates from aggregating
- A high concentration of spectator ions can also caused aggregation, so this method cannot be used with all samples.
- The analyte must also be concentrated enough, as the colour will not be seen if there is too little precipitate.
- The pH of the titration reaction must be carefully controlled as anionic dye indicators are conjugate bases of weak acids. This means it will react with free $\ce{H+}$ and will not adsorb onto the surface of the precipitate.
Atomic Absorption Spectroscopy
- Atomic absorption is explained by both the Bohr and Schrodinger models of the atom.
- However, for simplicity, the chemistry syllabus explains it in terms of the Bohr model (physics spends an entire chapter of most textbooks to get the Schrodinger explanation)
Atomic Absorption
The Bohr model of the atom where electrons are contained in shells around the nucleus of the atom:
The further away from the nucleus, the higher the energy level of the shell
These shells have discrete or quantised energy levels
The lowest energy electronic configuration of an atom is called the ground state
When electrons in the ground state (gas) absorb light energy (photons) corresponding to a difference between levels, they are excited to a higher energy level.
The light that passes through the sample without being absorbed can be collected as an absorption spectrum.
The absorbed wavelengths of light can be seen as black lines on a bright background.
The energies of the absorbed wavelengths match energy gaps between two shells.
As each element has a unique set of energy levels, the wavelengths of light absorbed by each element is characteristic.
- You may have noticed that the diagram above is the same one used for the flame test earlier.
- This technique, just like all other spectroscopy techniques, functions on the same principle as the flame test: a sample is exposed to a range of the electromagnetic spectrum, and the sample gets energised by particular energies, releasing specific colours (wavelengths).
- In the same way that barium will always produce a green flame in the flame test, it will always have a specific pattern that appears in a spectrum (which is unique to that element or molecule).
- By comparing this pattern to laboratory standards (basically the flame test colour chart, but for spectroscopy), the substances present can be determined.
- The only major difference (other than the wavelengths used and method of irradiation) between the flame test and spectroscopy is that flame tests are qualitative, while spectroscopy techniques are quantitative.
AAS
- Atomic absorption spectroscopy is a sensitive and highly selective technique that can be used to measure small concentrations of metal ions.
- It has an important role in the detection of toxic heavy metals.
- In AAS, the concentration of the analyte is calculated from the amount of each wavelength of light absorbed by the sample.
- The wavelength used in the analysis is based on atomic absorptions of the analyte.
- The amount of light absorbed is called the absorbance. It is determined from the relative intensities of light before and after the sample.
$\orange{A=\log_{10}\left(\frac{I_{0}}{I}\right)}$
- Where $A$ is the absorbance, $I_0$ is the intensity of light before the sample, and $I$ is the intensity after the sample.
- Measured absorbance is directly proportional to the concentration of analyte present in the sample.
How does AAS Work?

- An aqueous solution of sample is drawn up through a fine capillary tube into a nebuliser which turns it into a fine mist.
- Carrier gases (air and acetylene) sweeps the droplets into the furnace, which burns the solvent off and atomises the sample (to their ground states).
- The hollow cathode lamp emits wavelengths of light matching the energy gaps of the element being analysed through the atomised sample
- Analyte atoms in the sample will absorb a fraction of light
- The remaining light passes to a monochromator which selects a wavelength of light for analysis.
- The photomultiplier detector measures the intensity of light and replays the data to the analysis software.
- The hollow cathode lamp contains the element which being tested. It emits a certain spectral pattern – unique to each metal.
Calibration using Standard Solutions
- The calibration curve is used to establish the relationship between measured absorbance and the analyte concentration for a particular instrument.
- It is produced by measuring the absorbance of standard solutions, because absorbance is proportional to concentration for dilute samples in AAS.
- Best results are obtained when $0.1\leq A\leq0.8$.
- At higher concentrations, interaction between analyte atoms affect the absorbance values, leading to inaccurate data.
- At lower concentrations, the instrument response may not be sensitive enough.
Applications of AAS
- Quick, easy, accurate, and highly sensitive method of determining the concentrations of elements.
- Provides a means of investigating low-concentration phenomena, such as trace nutrients and heavy metal pollution (both usually between 1-100ppm, far too small for titration analyses).
Advantages and Disadvantages of AAS
| Advantages | Disadvantages |
|---|---|
| Simple procedure | High initial cost |
| Very sensitive (can measure up to ppb) | Can only test for one substance at a time (except extremely high-end equipment like drug test labs) |
| Extremely accurate | Only metals and a few non-metals can be tested for |
| Specific (can analyse individual ions in a mixture) | Cannot distinguish oxidisation states of metals |
| Only uses small sample size | Destructive test |
| Very fast (around 1 minute per element) | Only tests aqueous solutions |
| Very little sample preparation required |
Colorimetry
- Colorimetry (not to be confused with Calorimetry, although they sound very similar) is a technique for determining the analyte concentration based on the absorbance of a coloured solution.
The amount of light that is absorbed by the sample is compared to the amount absorbed by a reference
- The reference contains all components of the measured sample EXCEPT the analyte
Coloured solutions absorb their complementary colour, which is opposite from them in the color wheel
- A shortcut is to take “ROYGBIV” and move it along 4 places to find the complementary colour.
The wavelength of light used in colorimetry corresponds to the strongest absorption of the analyte of interest, known as the absorption maximum $(\lambda_{max})$
- This wavelength is used as sensitivity increases with the intensity of absorption, allowing for more accurate data to be collected.
- However, this requires an intensely coloured analyte.
The main coloured species analysed by colourimetry are transitional metal complexes.
Transition metal ions are often weakly coloured in solution, so they are commonly converted to intensely coloured transition metal complexes to allow for quantitative analysis.
The colour of complex ions depends on:
- Central metal ion
- Ligands
How colorimetry works

A light source provides a continuous source of white light which is narrowed and aligned into a beam using a slit.
A coloured filter allows a small range of wavelengths to pass through the sample, and blocks the other wavelengths.
The light beam passes through the sample, which absorbs a fraction of the light
The remaining light is transmitted through the sample and reaches the detector, which converts the
amount of light into an electrical signal.
- The calculation of absorbance is similar to the method for AAS:
$\orange{A=\log_{10}\left(\frac{I_{0}}{I}\right)}$
- Where $A$ is the absorbance, $I_0$ is the intensity of light passing through the reference/blank sample, and $I$ is the intensity of light passing through the analyte sample.
There is another method of calculating colorimetric absorbance: $A=ε\ell c$
- Where $ε$ is the molar absorptivity (in $l/cm/mol$), $\ell$ is the path length through the sample (in cm), and $c$ is the concentration of the substance in the sample (in mol/L)
- Many factors can influence the absorbance readings therefore, it is always more accurate to construct a calibration curve by measuring the absorbance of standard solutions under the sample experimental conditions.
- This helps to reduce systematic error.
- Similar to AAS, absorbance is proportional to concentration for samples with moderate absorbances (0.3 – 2.5). Samples should be concentrated or diluted so that measured absorbances are in the range where the relationship is linear.
Determination of Iron Content using Colourimetry
Due to the pale green colour of Iron (III), it cannot be directly measured using colourimetry.
Instead, we can convert it to the distinctly coloured $\ce{[Fe(SCN)]^{2+}}$ complex:
Iron (II) is oxidised to Iron (III) using acidified hydrogen peroxide:
- $\ce{2Fe^{2+} +2H+ +H2O2 →2Fe^{3+} +4H2O}$
Pale green Iron (III) is then reacted with colourless Thiocyanate to form the deep red Iron (III) Thiocyanate complex:
$\bbox[5px, border: 2px dotted green]{\ce{Fe^{3+}}}+\bbox[5px, border: 2px dotted grey]{\ce{SCN-}}\rightarrow\bbox[5px, border: 2px solid red]{\ce{Fe(SCN)^{2-}}}$
- This complex will strongly absorb blue light (complementary colour), at a wavelength around 447nm.
Determining Stoichiometry using Colourimetry
- Colourimetry can be used to determine the stoichiometric ration of reactants in the formation of an ionic species such as a coordination complex.
- The absorbances of a series of solutions containing different ratios of reactants are measured at a wavelength absorbed by the product.
- The correct stoichiometry of reactants is given at the maximum absorbance.
- The measured absorbances of the solutions are plotted against the volume of a reactant used, and the maximum absorbance is found using lines of best fit.
- The ratio of the reactants in the product corresponds to the moles combined to achieve the maximum absorbance.
Spectroscopy of Organic Compounds
- The wavelengths absorbed by an organic molecule can be matched to its structural fragments.
- A structural fragment that absorbs a characteristic wavelength is called a chromophore.
- The overall spectrum can also be used as a signature or fingerprint of the whole molecule.
- By comparing the collected spectrum with a database of standards, the compound can be identified.
UV-Visible Spectrophotometry
UV-visible spectrophotometers can also be used to measure the absorbance of a sample over a range of wavelengths.
The prism is rotated so that different wavelengths (between 190 and 700nm) pass through the monochromator, sample, and detector.
The absorbance at each wavelength is recorded, and then plotted against wavelength.
This plot is then compared to laboratory standards to find the absorption maximum of the sample.
This method is typically used to detect the presence of conjugation within organic molecules (where molecules have alternating double/triple and single bonds)
The UV-visible spectra occur as a result of electron shell transitions, just like with metals and complexes in other forms of spectroscopy.
Since organic compounds are good at absorbing UV and visible wavelengths, certain wavelengths correlate to certain bonds.
UV below 190nm requires specialist equipment, such as a vacuum spectrometer.
Interpreting UV-Visible Spectra
- A UV-Vis spectrum is a plot of absorbance versus absorbed wavelengths.
- By comparing the wavelength of the highest peak to a database of standards, the type of bonds in a compound can be identified. Some of these are on the datasheet.
| Bond | $\lambda_{max}$ (nm) |
|---|---|
| $\ce{C-H}$ | 122 |
| $\ce{C-C}$ | 135 |
| $\ce{C=C}$ | 162 |
| $\ce{C#C}$ | 137, 178, 196, 222 |
| $\ce{C-Cl}$ | 173 |
| $\ce{C-Br}$ | 208 |
- The exact wavelengths absorbed depends on the rest of the molecule, hence compounds have distinctive UV-Vis spectra.
- The presence of strong absorption bands in the spectrum above 200nm can generally be used to indicate the presence of conjugation in a molecule.
- The greater the extent of conjugation, the longer the wavelength absorbed.
Chemical Tests for Organic Analysis
Carbon-Carbon Double/Triple Bonds
- All halogens are coloured in solution.
- By mixing a coloured halogen (usually bromine) with a carbon-carbon double bond, an addition halogenation will occur, decolourising the solution.
- This can be used to identify whether a double/triple Carbon bond is present.
- However, this method does not determine where the double bond is in the molecule, how long the molecule is, if any functional groups are present, and whether the bond is double or triple.
Hydroxyl Groups (Alcohols)
- All alcohols react readily with sodium.
- Only small pieces of sodium should be used, as large pieces react rapidly, creating hydrogen gas and lots of heat (ultimately producing an explosion)
$\ce{2CH3(CH2)_{n}OH +2Na → 2CH3(CH2)_{n}ONa +H2}$
- The gas produced can be confirmed to be hydrogen using the pop test.
- Alternatively, the pH of the salt (known as an alkoxide salt) can be tested with an indicator.
- Alcohols have neutral pH, while alkoxide salts are strong bases.
- The type of alcohol can be tested using an oxidising agent:
- Primary alcohols react with Permanganate, changing from purple to colourless.
- Secondary alcohols react with dichromate, changing from orange to green.
- Tertiary alcohols don’t oxidise.
Carboxyl Group (Alkanoic Acids)
Carboxylic/Alkanoic Acids contain the $\ce{-COOH}$ Carboxyl functional group.
They are weak acids, meaning they partially dissociate in water.
Using an indicator can determine whether these compounds are present.
- An aqueous solution of carboxylic acid will turn blue litmus paper red.
A carbonate test can also be performed.
Carboxylic acids react with Metal Carbonates and Metal Hydrogen Carbonates to produce a salt, Carbon Dioxide, and water.
$\ce{2H+_{(aq)} +CO^{2-}3_{(aq)} → CO2_{(g)} +H2O_{(l)}}$
The bubbles produced are carbon dioxide, indicating that a reaction has occurred (this can be tested using the limewater test).

IR Spectroscopy
- IR Spectroscopy analyses the interactions between molecules and IR light.
- It primarily assists with identifying bonds and functional groups, and can be used for fingerprinting a molecule.
- The absorption of IR radiation by an organic compound is associated with a change in the vibrational energy levels of the molecule, as IR induces these vibrations.
- The bonds between atoms act like springs, where additional energy causes more motion.
- However, molecular vibration energy is quantised, meaning it can only occur in discrete levels.
- When a molecule is energised with radiation that matches its bond energy levels, it will jump to the higher energy state, resulting in an increased vibrational amplitude.
- Since different bonds give rise to different vibrational frequencies, each functional group will absorb a diffferent range of IR.
- This absorption frequency can be used as a marker for the presence of functional groups.
IR Inactive Molecules
- IR spectroscopy relies on a change in the dipole momentum of a molecule.
- For atoms that don’t have dipoles, such as $\ce{H2},$ the IR will be absorbed, but not cause a change in the dipole momentum.
- Therefore, non-dipole bonds cannot be observed using IR spectroscopy.
IR Spectrometers
](https://cdn.statically.io/gh/psharma04/image-repo/main/uploads/IR%5c_spectroscopy%5c_apparatus.min.svg)
- The IR Radiation source is an inert solid that is heated electronically, causing thermal emission of radiation in the infrared range.
- This incident light is split into 2 equivalent beams which are passed through a reference material and the sample, where some energy is absorbed, and some is transmitted.
- The beam splitter passes the rays to the monochromator, which then filters out a single wavelength.
- The detector calculates the ratio between the intensities of the two beams to determine the absorbance.
Interpretation of an IR Spectrum

- The transmission is plotted, with absorbed wavelengths showing troughs (pointing down)
- IR absorption wavelengths are reported in wavenumbers, which is the number of waves in a specific distance (usually cm).
- The x-axis is non-linear, while the y-axis is a percentage.

Advantages and Disadvantages of IR Spectroscopy
| Advantages | Disadvantages |
|---|---|
| Only requires milligram-sized samples which can usually be recovered (i.e. non-destructive) | Structural features cannot be identified |
| Quick, easy, and cheap | Complex mixtures result in distortion and essentially unusable results |
| Can be used for fingerprinting (e.g. drug tests) | Samples must be extremely dry in order to avoid OH bonds from appearing where they shouldn’t |
Elemental Analysis
Combustive Analysis
- Elemental Analysis of organic compounds is the determination of mass fractions or percentages of carbon, hydrogen, or heteroatoms in a sample.
- This information can be used to determine the empitical formulae of unknown compounds.
- The mass of each element can be determined using combustion analysis:
- Burn a weighed sample of organic matter in excess oxygen, then collect and weigh the combustion products.
Mass Spectrometry
- An analytical technique for studying the chemicals present in a sample.
- A mass spectrometer measures mass by volatising and then ionising them.
- A small (nanogram) sample is injected into the spectroeter, and then vaporised to its gaseous state
- The sample is then ionised by an electron beam, which creates cations
- Most of these cations will decompose into daughter ions and radicals
- Cations are then accelerated into a magnetic field, causing them to travel on a curved path.
- The curvature depends on the mass-charge ratio of the particles (m/z), with larger ions and lower charges being deflected less.
- The m/z values are then detected as a spectrum by a computer

Interpreting Mass Spectra
- The mass spectra records the abundance of different m/z ratios relative to the most intense peak (most abundant), referred to as the base peak.
- Usually, the m/z is the same as mass, since the charge $z$ is usually +1.

Mass spectra can be used to determine the molecular formula of a substance:
- Ions with greater mass will correspond to molecules that only lost a single electron (parent ions), giving the relative molar mass of the intact molecule.
- Masses from the detected fragments can be used to deduce structural information about the molecule.
The detected masses of fragments can be used to deduce structural information about the molecule, which can then be reassembled to identify the original molecule.
The fragment ions that are observed (as well as their abundance) is determined by the stability of that ion
- More stable ions have higher abundances
- The base peak will be the most stable fragment.
Different types of fragments have different stabilities, producing unique fragmentation patterns, or fingerprints, which can be used
| Mass | Fragment |
|---|---|
| 15 | $\ce{-CH3}$ |
| 17 | $\ce{-OH}$ |
| 29 | $\ce{-CH2CH3}$ or $\ce{-COH}$ |
| 31 | $\ce{-OCH3}$ |
| 43 | $\ce{-CH2OH}$ |
| 45 | $\ce{-COOH}$ |
Isotopes in Mass Spectra
- Some elements have more than 1 isotope in high abundance
- Typically, chlorine and bromine have isotopes that differ by a mass of 2
| Isotopes | Natural Abundance (Percentage) |
|---|---|
| $\ce{^35_17Cl}$ | 76 |
| $\ce{^37_17Cl}$ | 24 |
| $\ce{^79_35Br}$ | 51 |
| $\ce{^81_35Br}$ | 49 |
- The presence of these isotopes can be observed in the mass spectra of chlorinated or brominated compounds.
Uses of Mass Spectrometry
Due to the sensitivity of mass spectrometers, the mass spectra of compounds can be used as fingerprints for identifying compounds.
Mass spectrometry can be used to unambiguously identify a substance as no two substance produce the same fragmentation pattern
Experimentally obtained spectra can be compared with databases of known substances
Mass spectrometry is often used in conjugation with chromatographic separation and is routinely used to analyse a wide range of industrial, environmental and forensic samples. It is also used for:
- Detect and identify the use of steroids in athletes
- Identify compounds in illicit drug samples
- Monitor the breath of patients by anaesthetists during surgery
- Determined whether honey is adulterated with corn syrup
- Locate oil deposits by measuring petroleum precursors in rock
- Monitor fermentation processes for the biotechnology industry
- Detect dioxins in contaminated fish
- Establish the elemental composition of semiconductor materials
Advantages of Mass Spectrometry
- Can be used to determine a substances molecular formula
- The masses of fragment ions can be used to identify structural fragments in the molecule
- Isotopes can be determined, and used to match a sample to a particular source
- It is quick, highly sensitive technique that can be performed on very small samples
Disadvantages of Mass Spectrometry
- Mass spectrometry is less useful in the analysis of very complex mixtures
- When hundreds of compounds are present in a sample, there may be so many peaks present that it becomes impossible to determine what fragments are present
- In these cases, mass spectrometry can be used to determine molecular masses and molecular formula, but cannot be used to determine the structure of components
- Overshowed by the large quantity of structural information available in NMR spectroscopy.
NMR Spectroscopy
Nuclear Spin
- Nuclear Magnetic Resonance (NMR) spectroscopy is one of the most powerful techniques for the analysis of organic compounds.
- If a nucleus contains an odd number of protons and/or odd number of neutrons, it can exhibit spin (similar to electron spin).
- As a result, the nucleus may behave like a magnet in a magnetic field, and can be detected by NMR (known as spin-active).
- The spins of the nuclei in a sample will not be oriented, and are initially considered “degenerate” (same energy).
- However, when placed in an external magnetic field, the spin-active nuclei will adopt one of two states:
- A higher energy spin state aligned against the magnetic field (antiparallel)
- A lower energy spin state aligned with the magnetic field (parallel)

The difference in energy between the two spin states is known as $\Delta E$, and this amount of energy corresponds to a specific frequency in the EM spectrum.
Typically, NMR spectra are produced by placing a sample in a magnetic field, with radio waves of different frequencies being passed through them.
When the energy of the wave matches $\Delta E$, the energy is absorbed, and the nucleus transitions to the higher energy spin state, or release this energy and drop back down.
Physics students will be familiar with the Planck equation, $E=hf$, which is the same relationship that enables NMR spectroscopy.
- The switching of spin states is called “resonance”.
Carbon-13 NMR Spectra
Most carbon atoms in a sample will be Carbon-12, which cannot be analysed using NMR.
However, around 1% of the carbon will be C-13, which is spin active and therefore can be detected using NMR spectroscopy.
In a similar manner to H-NMR, a carbon-13 NMR spectrum gives information about the number and types of carbon environments in a molecule.
The frequencies absorbed are proportional to the magnitude of $\Delta E$
It is known that moving electrically charged particles produces a proportional magnetic field.
Since electrons are moving and charged, they generate a magnetic field which changes the size of $\Delta E$ and therefore which frequencies are absorbed (this is known as Electron Shielding)
Electron shielding means that unique chemical environments are created within a molecule, depending on which atoms and bonds are nearby.
The number of unique chemical environments determines how many unique values of $\Delta E$ are possible, ultimately matching the number of signals in an NMR spectrum.
Carbon Environments
- When looking at any 2 carbon in a molecule, we can describe them as having either similar or distinct chemical environments.
- Two carbon atoms are considered similar if they can be interchanged via bond or spatial rotation without affecting the chemical signal.
This is one of those things best explained with an example.
If you have a sample of butane, the carbons at position 2 and 3 can be interchanged by rotating the molecule 180 degrees. Since there is no difference between the two, they are considered to have similar environments.
However, the carbon at positions 1 and 3 cannot be interchanged by rotating the molecule, so they are distinct.
In the case of butane, it can be said that 2 carbon environments exist: the environment experienced by atoms 1 and 4, and the environment experienced by atoms 2 and 3.

Chemical Shift
- The resonance frequencies in an NMR spectrum are converted to values known as chemical shift, measured in parts per million (ppm).
- Converting to chemical shift remove the impact of magnetic field strength, which increases $\Delta E$.
- This allows the comparison of spectra collected in spectrometers of different strengths.
- The chemical shift (position of the signal) that a nucleus produces depends on electron shielding.
- A nucleus surrounded by low electron density is less shielded, so it experiences more of the magnetic field and resonates at higher frequencies (higher ppm).
- A nucleus surrounded by high electron density is more shielded and will resonate at a lower frequency (lower ppm).
- Tetramethylsilane (TMS) is usually added to samples as a standard.
- Different types of carbon environments have characteristic chemical shifts, generally between 0 and 220ppm.

Proton NMR Spectra
The number of signals in the spectrum matches with the number of unique hydrogen environments.
Different types of hydrogen environments have characteristic chemical shifts:
- Decreased electron shielding leads to downfield shifts (higher ppm).
- TMS is also used as a standard, and has a chemical shift of 0ppm.
The chemical shifts can be divided into regions:
| PPM | Location of H |
|---|---|
| 0-1.5 | Saturated carbons |
| 1.5-2.5 | Unsaturated carbons |
| 2.5-4.5 | Protons attached to electronegative atoms (e.g. R-OH bonds) |
| 4.5-6.5 | Alkene carbons |
| 6.5-8.0 | Aromatic rings (e.g. benzene) |
Integral and Spin-Spin Splitting in H-NMR
Integrals (Area Under the Curve)
- The area under the signal corresponds to the number of hydrogen nuclei in that environment.
- Use a ruler to measure the ratio.
Splitting (Multiplicity)
- In H-NMR each signal can be split into multiple peaks, called a multiplet.
- Splitting arises from the interaction of the spins of nearby nuclei, called coupling.
- Splitting follows the $N+1$ rule: protons that have $N$ protons in a different chemical environment on immediately adjacent carbons show $N+1$ peaks in their signal.
- The heights of the peaks in multiplet matches Pascal’s triangles, with taller peaks in the middle and a symmetrical structure.
| Neighbouring H | Peaks in Signal | Multiplicity | Ratio of Heights |
|---|---|---|---|
| 0 | 1 | Singlet | 1 |
| 1 | 2 | Doublet | 1:1 |
| 2 | 3 | Triplet | 1:2:1 |
| 3 | 4 | Quartet | 1:3:3:1 |
| 4 | 5 | Quintet | 1:4:6:4:1 |
| 5 | 6 | Sextet | 1:5:10:10:5:1 |
| 6 | 7 | Septet | 1:6:15:20:15:6:1 |
Advantages and Disadvantages of NMR Spectroscopy
- NMR Spectroscopy by far is the most powerful technique for determining and confirming the structures of organic compounds, due to the large amount of structural information given in a spectrum.
- NMR is less sensitive than other techniques, so the sample sizes required are larger than for other techniques.
- However, NMR spectroscopy is non-destructive for samples can be recovered.
- Highly complex, large molecules will produce a spectrum that are difficult to interpret.
- Compounds must be dissolved in a suitable solvent to produce a clear NMR spectrum.
- NMR spectrometers maintenance requires technical support.
Chemical Synthesis and Design
Chemical synthesis refers to the purposeful use of chemical to obtain a desired product.
A synthesis reaction is when smaller compounds undergo a chemical reaction to produce a larger compound (product).
The development of chemical syntheses for desirable product compounds has been fundamental to our standard of living, addressing issues such as:
- Replenishment of depleting resources,
- Large-scale production of compounds that are scarce in nature,
- Development of unique chemicals to address specific needs.
Designing a Chemical Synthesis Process
Considerations for a Reaction Pathway Design
Desired products typically cannot be produced in a single step from the available starting materials.
Instead, a multi-step chemical synthesis is required.
A reaction pathway is commonly designed by working backwards from the desired product and identifying the intermediate products and reaction conditions that would result in the formation.
The analysis of a compound to devise a suitable reaction pathway is called a retrosynthetic analysis.
A retrosynthetic analysis can often identify a number of alternative reaction pathway to produce a desired product.
A number of factors are considered when selecting the most desirable reaction pathway:
- Availability of reactants and reagents
- Yield/purity of product
- Reaction conditions
- Economic factors (e.g. industrial uses of byproducts)
- Environmental impacts
- Social impacts
Availability of Reagents
- The availability of reagents is a significant factor in the selection of a reaction pathway.
- Hard to obtain (e.g. supply and demand)
Yield and Purity
- The yield of reaction is the amount of product obtained compared to the theoretical maximum expressed as a percentage.
- The theoretical maximum amount of product that can be formed from a reaction is based on the amount of limiting reagent.
- The amount of product that is obtained from a reaction is commonly expressed as a percentage of the maximum theoretical yield.
$$\orange{\text{Percentage Yield %}=\frac{\text{Actual Yield (g)}}{\text{Theoretical Yield (g)}}}$$
- An additional consideration in the selection of a reaction pathway is the number of steps required to convert a given starting material to the desired product compound.
- The overall yield of a reaction pathway typically decreases with the number of steps in the reaction sequence.
- A reaction pathway with a large number of single steps reactions will result in a low yield.
- The overall yield for a multi-step reaction pathway can be calculated from the yield for each of the individual steps.
$$\orange{\text{Overall Yield %}=\frac{\text{Yield of first step %}}{100}\times\frac{\text{Yield of second step %}}{100}}$$
Linear and Convergent Synthesis
- A linear synthesis is where each intermediate product was the reactant for next subsequent step.
- One strategy to improve the overall product yield of a multi-step reaction pathway is convergent synthesis.
- A convergent synthesis reduces the number of linear steps in a sequence by using individual reaction pathways to synthesise the intermediate products.
- The intermediate products are then combined in a single step to generate the final desired product.
- A convergent reaction pathway typically has a higher overall yield compared to the same reaction pathway performed as a linear sequence.

Selectivity
- An additional consideration in the selection of a reaction pathway is the selectivity of each individual step to form the desired product.
Purity
- Purity refers to the amount of desired product in a sample, expressed as a percentage.
- Product purity is commonly used as a measure of quality of a product.
- Typically, higher purity chemicals are more labour intensive to produce than lower purity chemicals due to the need for additional purification processes.
- Product purity is continually monitored throughour chemical manufacture to ensure that the product meets specifications.
- This is known as quality control.
Reaction Conditions
- Reaction conditions must be considered when designing syntheses.
- Conditions are adjusted to ensure the desired product can be obtained in high yield and at a reasonable reaction rate.
- This is particularly important in the chemical industry, where small gains in yield and rate can dramatically improve profitability.
- To increase the viability of an industrial process:
- Maximise yield
- Maximise rate
- Minimise waste
- Use the by-product of the reaction for something else
- Recycle energy
- Safety
- Reaction conditions that are commonly optimised to improve the yield and/or rate of a chemical process include:
- Concentration of reaction and products
- Temperature
- Pressure
- Catalyst
- However, there are other considerations in addition to product yield and reaction rate when selecting optimal temperature and pressure conditions:
- High temperatures can be unsafe.
- Specialised equipment and greater energy is required to maintain high pressures.
- Side reactions are more likely at higher temperatures.
- Reactants, products, and catalysts often decompose at high temperatures.
- Catalysts are often very expensive relative to the other reagents.
Environmental Issues
- Most industrial processes consume large amounts of energy.
- For example, the production of ammonia (via the Haber process) accounts for the 1.2% of the global energy consumption each year.
- Issues of high energy consumption may include
- Greenhouse gases
- Carbon monoxide (toxic gases)
- Energy should be recycled wherever possible to minimise cost and impact.
Thermal Pollution
- Many industrial processes use high temperature processes, which means cooling the products is often necessary.
- Water is commonly used as a coolant as there are large water bodies with large thermal mass available.
- Discharging warm water into the environment may cause thermal pollution, resulting in the death of aquatic life.
- Holding ponds allow water to cool before discharge.
Toxic Emissions
Chemical processes should be designed to use substances that minimise hazards to users and the environment.
For example, the production of sulfuric acid is associated with the fugitive emission of $\ce{SO2}$.
- It is a toxic gas, which forms sulfuric acid in water.
Toxic emissions should be carefully monitored to reduce environmental impact.
Waste Disposal
- Depending on the chemical process, different types of waste are generate which must be appropriately handled.
- Acidic wastes are generated by many industrial processes.
- Solid wastes, if inert, are often discharged into the ocean.